
I Got Quicker at Debugging and So Can You
Eradicate those Annoying Little Code Demons with these Tools and a Few Lines of Custom Code I Developed
by Michael Suhrbier, eXcelisys Web App Developer
If you’re like me, you’re always seeking tricks to help you debug more quickly. There are plenty of tools. You’ve probably heard of these MySQL / PHP debugging techniques:
- Xdebug — Great if you can get it working.
- BackTrace(), print_r(), var_dump(), etc. — Very useful but usually very ugly and not easy for humans to read and understand.
- PHP / MySQL logs — Fine for the average user, but let’s explore some methods for putting these guys on steroids.
Xdebug is great when you can get it to work. However, I’ve spent days getting it to behave correctly. With multiple clients to tend, setting this up for each one is not the best use of my time. I won’t even go into the details. Instead, I will focus on easy-to-install, use and understand tools.
Can’t Find the Issue? Try Kint
My favorite tool of all times is a little-known library called Kint. I could not develop custom websites as efficiently as I do without it.

This is one of those rare tools that actually makes you go WOW, where have you been all my PHP career? I don’t even start a project until I have it “installed,” by which I mean, use the 1-line include:
include($_SERVER['DOCUMENT_ROOT']."/kint.php");
That’s all you need, but what does it do?
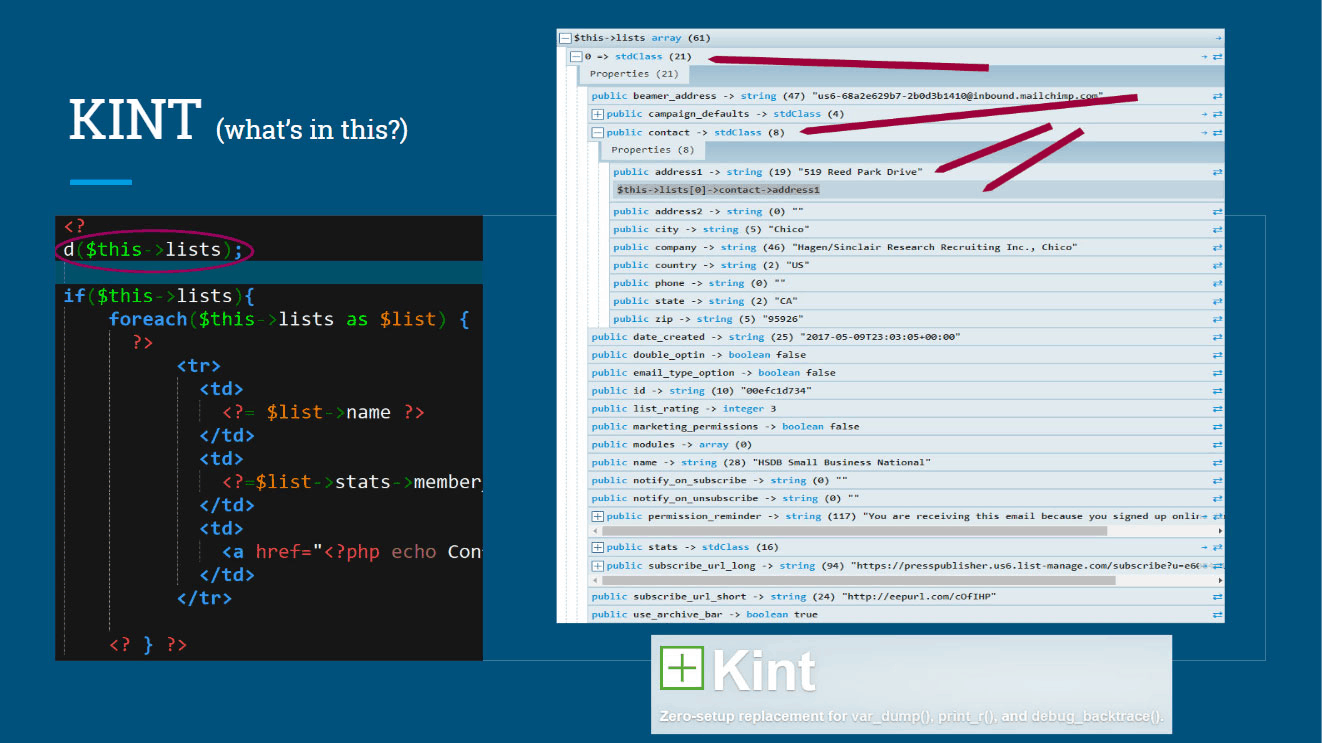
Have you ever wondered what is in a variable, a class, an array, or just about anything? Just throw it in Kint and you will know!
d($variable, $class_name, $string, $GLOBALS, $_REQUEST);
The output is beautiful, full of details and easy to understand. You are even given copy-and-paste code to get at the value you want!
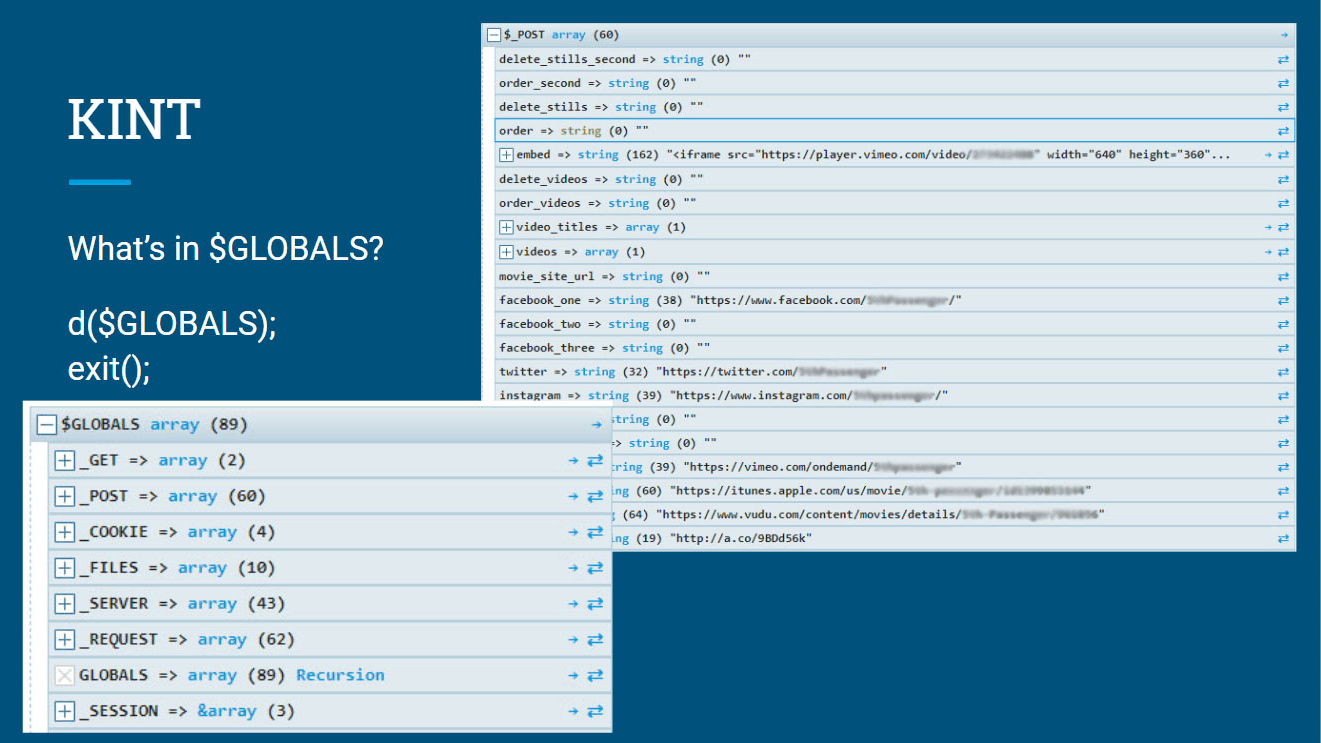
Have you ever banged your head trying to figure out what eXactly is in a form post? Just hand it to Kint!
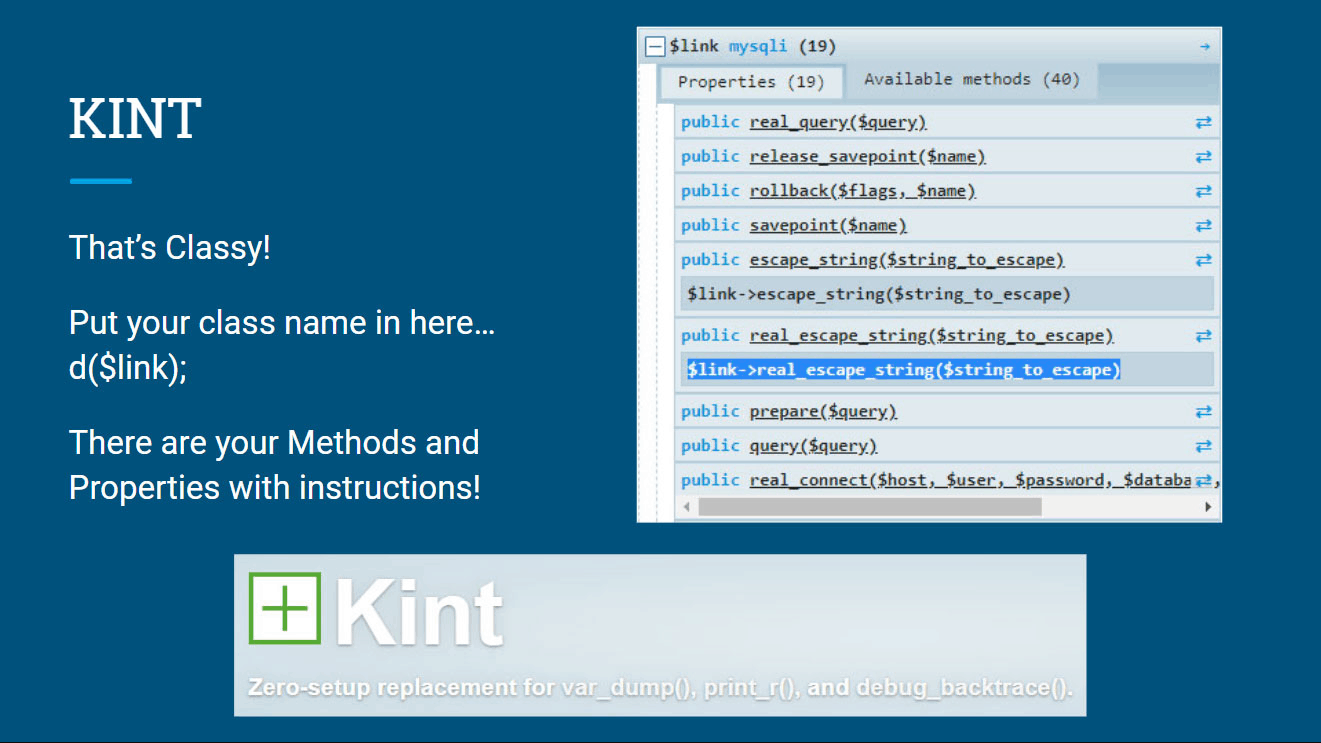
How about, What the hell is in that class and how do I use it? Again, copy and paste the property or method you are after. Seriously, that’s cool!
Kint has many modifiers that are great for AJAX and plain text as well.
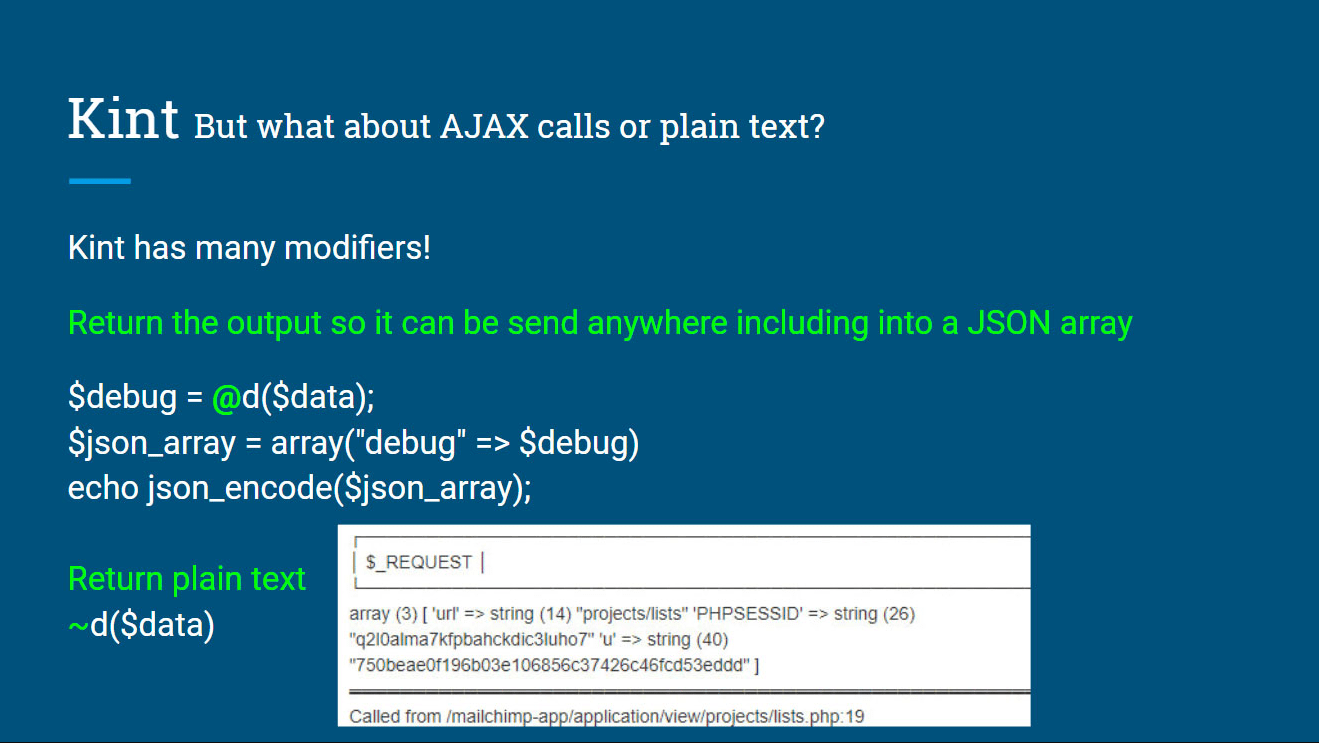
I’ve used Kint in many situations, but where I use it most often is for API responses. I don’t have to format the API response at all initially so KINT tells me eXactly what the structure of the response looks like and how I can best get at the parts of the response that I need.
Hustle that Code with PimpMyLogs
So what’s wrong with error_reporting(E_ALL) or just scanning the logs manually?
Again, nothing really, if you like digging for gold in them thar hills. Here’s one approach.
- Using
ini_set('display_errors', 1);(show errors on front end) is great in development but not so much for production. - So, I just read the logs … again, great, if you can find the logs and you don’t mind eXamining line-by-line for that gold.
- Take a shot if you grep the snot out a console window and think I’m lazy!
Now for the easy way! A super, simple-to-install tool that does just what it says.
Install via GIT:
git clone https://github.com/potsky/PimpMyLog.git
Install via Composer:
composer require "potsky/pimp-my-log"
Or the ole fashioned way (via archive):
https://github.com/potsky/PimpMyLog/zipball/master
Now that you have it installed, just open it in your browser and use the browser-based configuration tools. http://server_ip/PimpMyLog/
I’ve installed it at least a dozen times already and each time it was able to find the log files automatically, but you may need to find your log paths and enter them manually.
Now you have some pimped logs!
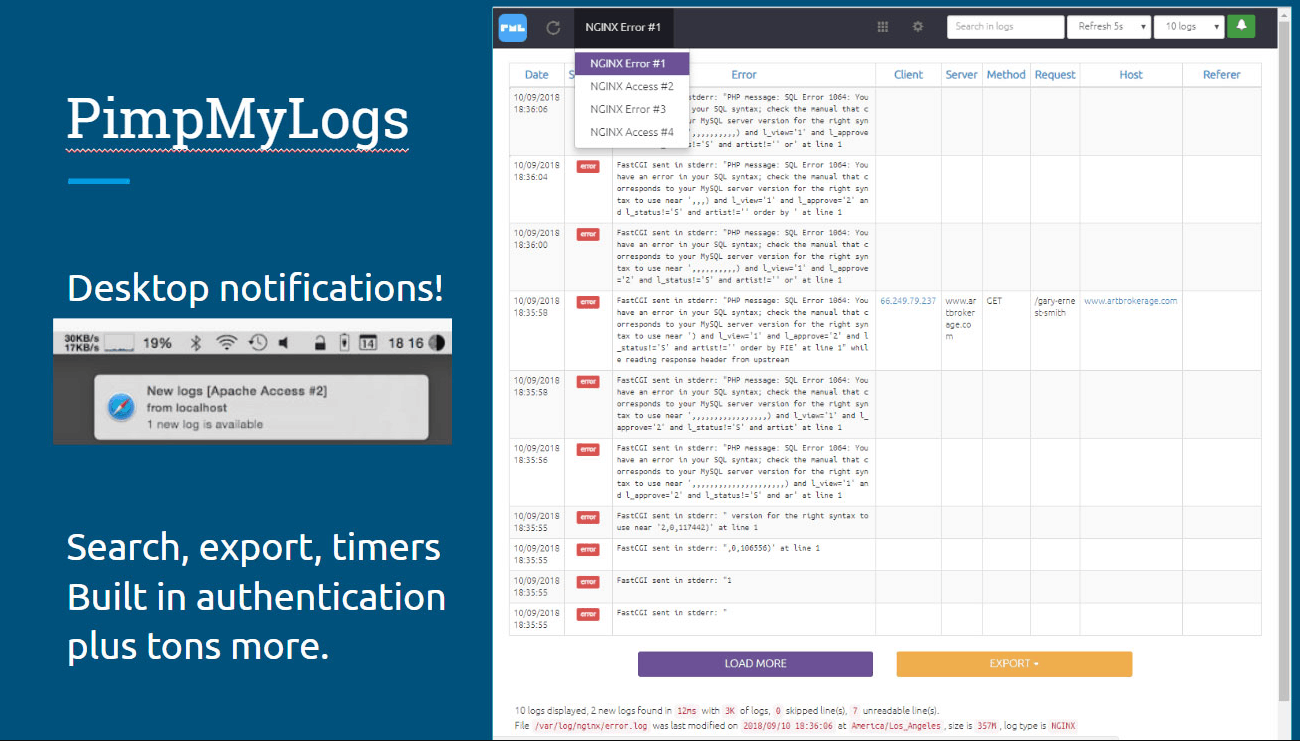
PimpMyLogs is browser-based so you are not jumping through hoops every time you need to see what’s going on with your custom web app. Plus, it can automatically refresh.
PimpMyLogs is great for debugging AJAX calls that might be hidden or otherwise hard to see. Having the desktop notifications turned on also helps because I can simply run my app or site until I see an error pop up in my taskbar without having to switch back and forth.

MySQL Debugging Done Quickly
OK, this might be misleading. I’m not talking about debugging SQL syntax, but how many times have you seen this in your logs?
FastCGI sent in stderr: "version for the right syntax to use near '2,0,117442)' at line 1
Not real helpful is it? I once watched a co-worker at a major healthcare provider struggle for weeks tracking down an SQL error that was flooding the logs. I sat at lunch thinking, There has to be a better way than guessing and doing code searches on huge code bases.

So I came back and wrote this simple — yet powerful — function that leverages the ease of PHP built-in logging and MySQL error reporting. I added this code to our sql.lib.php and had the problem code within seconds.
/*** Begin Michael Code LoJack ***/
if(!$res){
$client_details = '['.date('D Y-m-d h:i:s A').'] [client '.$_SERVER['REMOTE_ADDR'].']' . PHP_EOL;
$actual_link = (isset($_SERVER['HTTPS']) && $_SERVER['HTTPS'] === 'on' ? "https" : "http") . "://$_SERVER[HTTP_HOST]$_SERVER[REQUEST_URI]";
$actual_link = "[Link: $actual_link]" . PHP_EOL;
$back_trace = "[Back Trace:" . (new Exception)->getTraceAsString()."]" . PHP_EOL;
$query_ran = "[Query: $query]" . PHP_EOL;
$query_error = "[Query Error: " . mysqli_error($con_link). "]" . PHP_EOL;
error_log("$client_details $actual_link $back_trace $query_ran $query_error", 3, '/home/sites/dev.artbrokerage.com/captain6/PimpMyLog/dev.michael_lojack.log');
}
/*** End Michael Code LoJack ***/
Place this where your queries are happening or directly after what you suspect is your problem area. I simply place it in the SQL library/class (/libs/sql.lib.php) for the app like so:
function query($query, $usewritelink = false) {
$this->queries[] = $query;
$this->querycount++;
$tsparts = explode(" ", microtime());
$qstartts = $tsparts[1] + $tsparts[0];
$this->lastquery = $query;
if (preg_match("/^select /i", $query) && !$usewritelink){
$res = mysqli_query($this->readlink,$query);
$con_link = $this->readlink;
} else {
$res = mysqli_query($this->writelink, $query);
$con_link = $this->writelink;
}
$tsparts = explode(" ", microtime()); $qendts = $tsparts[1] + $tsparts[0]; $querytime = $qendts - $qstartts;$this->sqltime += $querytime;/*** Begin Michael Code LoJack ***/ if(!$res){ $client_details = '['.date('D Y-m-d h:i:s A').'] [client '.$_SERVER['REMOTE_ADDR'].']' . PHP_EOL; $actual_link = (isset($_SERVER['HTTPS']) && $_SERVER['HTTPS'] === 'on' ? "https" : "http") . "://$_SERVER[HTTP_HOST]$_SERVER[REQUEST_URI]"; $actual_link = "[Link: $actual_link]" . PHP_EOL; $back_trace = "[Back Trace:" . (new Exception)->getTraceAsString()."]" . PHP_EOL; $query_ran = "[Query: $query]" . PHP_EOL; $query_error = "[Query Error: " . mysqli_error($con_link). "]" . PHP_EOL; error_log("$client_details $actual_link $back_trace $query_ran $query_error", 3, '/home/sites/site/dev.michael_lojack.log'); } /*** End Michael Code LoJack ***/ return $res; }
You only need to adjust 2 things.
$con_link(which is just your connection string)'/home/sites/site/dev.michael_lojack.log'(where do you want to write your custom log file?)
This code is by no means perfect and probably could be optimized, but I only use it when I have a tough-to-track SQL query, so I’m not terribly concerned about the performance.
You are probably wondering why I didn’t just head for the MySQL error log. I’ve never actually worked on a site that had it enabled, so apparently, this is not a common thing.
But why a custom log? Well, PHP logs by default truncate error messages. I have tried every command I could possibly find to avoid truncation. This is the best solution I have found so far, plus I can add a bunch more useful information like the backtrace and URL that triggered the error.
Here’s what the result looks like:
[Thu 2018-10-18 03:12:28 AM] [client 99.35.116.149]
[Link: https://explorethemagic.com/booking]
[Back Trace:#0 /home/sites/explorethemagic.com/lib/booking_requests.lib.php(50): Database->query('select purchase...')
#1 /home/sites/explorethemagic.com/includes/booking_index.inc.php(22): BookingRequests->getBookingID('97539', 'paid')
#2 /home/sites/explorethemagic.com/controller.php(4020): include('/home/sites/etm...')
#3 {main}]
[Query: select booking_requests.* from booking_requests left join booking_requests_msg on booking_requests_msg.request_id=booking_requests.id where (booking.resort_id='97539') and (booking_requests_msg.to_id='97539' OR booking_requests_msg.from_id='97539') group by booking_requests.id order by booking_requests.date desc limit paid, 25]
[Query Error: Undeclared variable: paid]
Now, I have a copy-and-paste SQL string to test. In this case, the problem was obvious. My function call was missing a variable; therefore, it was dropping the word “paid” in where a query limiter should have been. I use this trick all the time because it makes me more efficient when providing web application services for clients.
Go Forth: Debug Quickly and Confidently Using These Cool Tips
I hope the title of this post didn’t mislead you into thinking I had discovered some magic silver bullet that would help you find errors and problematic code. Of course, there isn’t a quick magical remedy, but these debugging tips and tricks used together will greatly increase your ability to find problems.
I also suspect that many of you are probably saying, “Just use Xdebug” or one of the other real-time debuggers, but that isn’t always possible. Plus, each of these tools will be useful at some point on its own. Part of what I’m often tasked with here at eXcelisys is to put on my software detective hat and find that pesky bug that only appears occasionally. These tools help take the guesswork out of the process and save my clients time and money.

So now for a shameless plug. Do you have an app or site that is misbehaving? Talk to one of our Solution Consultants about our website repair services and request that I take a look at your issues. It doesn’t matter if it’s PHP debugging, MySQL debugging, whatever. I’d love to take a swat at it!
I love a good challenge, but what I like even more is a happy client telling me that I found the needle in the haystack that so many other developers just couldn’t find. ~ Michael Suhrbier
To read more web tips and tricks from our web app developers, check out eX-Cetera, our blog where we offer WordPress Tips and Tricks and other general Web Tips and Tricks.
**This article is provided for free and as-is; use, enjoy, learn, and experiment at your own risk – but have fun! eXcelisys does not offer free support or free assistance with any of the contents of this blog post. If you would like help or assistance, please consider retaining eXcelisys’ website maintenance and support services.
About eXcelisys, Inc.: Founded in 2001, eXcelisys (www.excelisys.com) is an FBA Platinum Partner and FileMaker Certified developer organization. eXcelisys specializes in designing, developing, customizing, supporting, consulting, migrating, upgrading, fixing and integrating database solutions for Desktop, Mobile, and Web applications. Our core technology competencies are FileMaker Pro, FileMaker Go, and MySQL for database frameworks, along with FileMaker WebDirect, WordPress, MySQL, PHP, CodeIgniter, PostgreSQL, Joomla, Drupal, Magento, CSS, HTML5, and Javascript for websites and web applications. Aside from providing eXcellent customer service, our goals are to use these technologies to intuitively automate your organization’s data solution needs seamlessly and flawlessly across the web, mobile, and desktop platforms. Contact eXcelisys today for a free estimate and consultation about making your business more efficient through intuitive and effective software automation. 866-592-9235.


Leave A Comment